As we wrote in our blog post about how stock market returns are almost never average, the stock market can have extremely large swings from year-to-year. Over time, stocks have offered attractive long-term returns, but not everyone has a long enough time-horizon or the stomach to ride the ups and downs.
Perhaps the simplest way for investors to address concerns about volatility in their investments is to invest less and keep some money in cash. However, as we have experienced in recent years, cash can lose purchasing power to inflation, and keeping too much money on the sidelines might mean earning returns lower than needed to meet the clients’ financial objectives.
Enter: bonds.
Let’s start with a simple mental model of how diversification could work in a fantasy world where returns are totally predictable.
Let’s say you could invest in Security A, which in even numbered years returns 10% and in odd number years has 0% returns. Over time, your average return would be 5% with a standard deviation (also referred to as volatility) of 5%. Then, imagine you could also invest in Security B, which is perfectly negatively correlated with security A, meaning that in even numbered years it returns 0% and 10% in odd years. Now, if you owned equal amounts of securities A and B, instead of seesawing between 10% and 0% returns, your average return would still be 5%, but it would be 5% every year meaning 0% volatility.
Of course, the real world is far messier than this hypothetical, however, we can identify pairs of securities that do move very differently from one another that can help provide a real-world example. One such pair is the S&P 500 and the US 10 Year Treasury bond which have a correlation of 0.02[1], which basically means the two move completely independent of one another.

Bonds issued by the US government are often referred to as “risk free” because they are backed by the full faith and credit of the United States (as well as its printing press), but bonds are not without risk, as evidenced by the 19 years bondholders saw negative returns.
We can visualize this diversification benefit by looking at historical returns and standard deviations of theoretical portfolios of all stocks (using the S&P 500 as a proxy for stocks) and bonds (with the US 10 Year Treasury as a proxy for bonds).
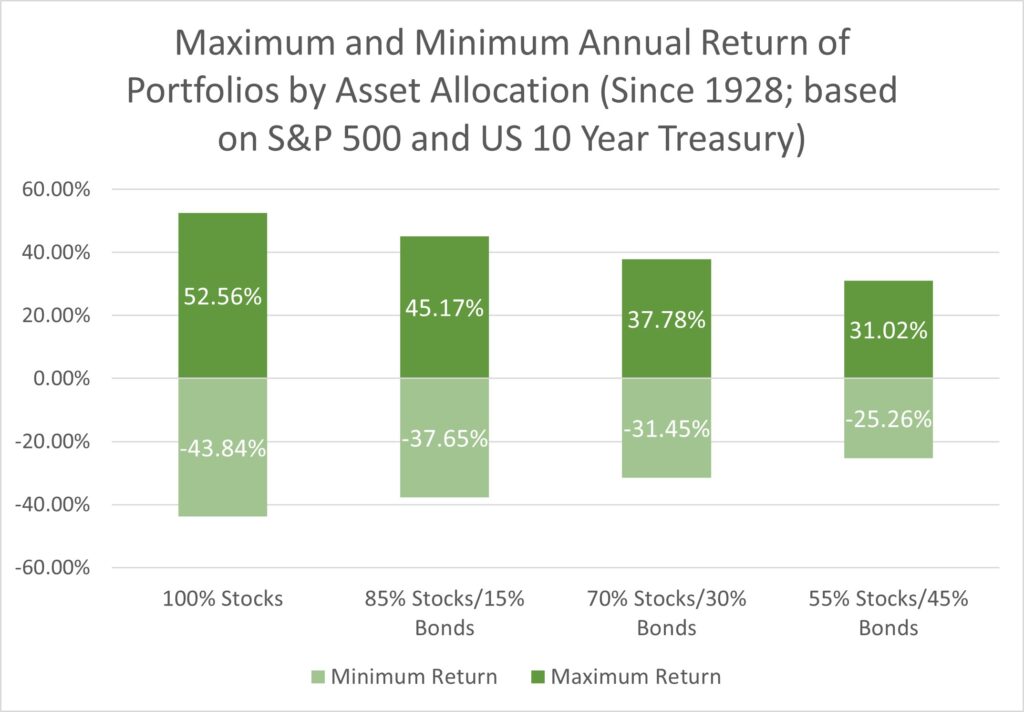
As we saw in the historical data earlier, stocks have a higher average return than bonds, so it is intuitive that owning less stocks in favor of lower returning bonds would decrease a portfolio’s average return. Less intuitive is the outsized impact adding bonds can have on the volatility of an account. Highlighting the 100% stock portfolio and the 70/30 portfolio of stocks and bonds, while we give up about 1.1% of average return (a reduction of 11% from the 100% stock portfolio) the standard deviation falls from 19.55% to 13.95%, or a reduction of nearly 30%!
[1] Data provided by NYU Professor Aswath Damodaran. Total returns (including dividends and interest) are shown for both the S&P 500 and US 10 Year Treasury bond since 1928. https://pages.stern.nyu.edu/~adamodar/New_Home_Page/datafile/histretSP.html
If you have any questions about this blog, or other questions about your finances, please contact Blue River Capital Management at 503.334.0963 or at info@brcm.co.
This information is intended to be educational and is not tailored to the investment needs of any specific investor. Investing involves risk, including risk of loss. Blue River Capital Management does not offer tax or legal advice. Results are not guaranteed. Always consult with a qualified tax professional about your situation

